Job 7
Session 1
A. Demonstration Images 31st Jan, 2022
Look at the following images:

B. Manual for doing the experiment

C. Learners with interest in the fundamentals may have a look here.
D. Demonstration Video 31st Jan, 2022
Carefully watch the following video:
Ask Your Question (about preprocessing) 8:00 am, 1st Feb, 2022 to 8:00 pm, 1st Feb, 2022.


Session 2

Instruction for Data Taking
Data should be taken strictly following the given volume values.
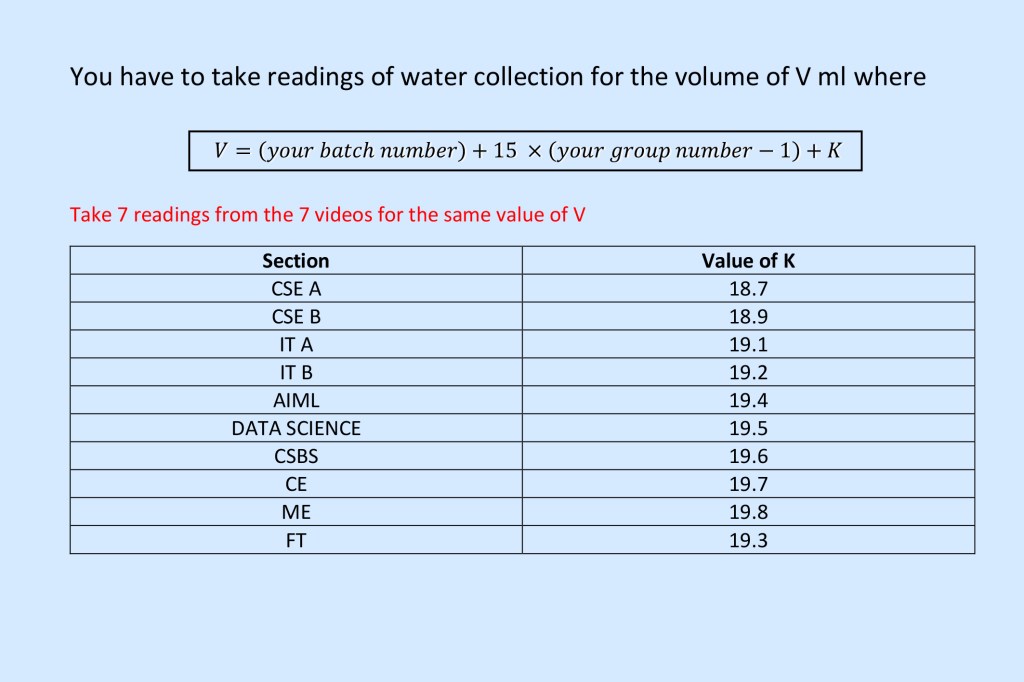
Readings are to be taken from the following videos. One reading for ‘a’, 7 readings for each of h1, h2, V and t. Readings of a for batch no. 12 and 13 of group 2 may be difficult. they may use readings of batch 12 and 13 of group 1.
You may reduce your Youtube screen resolution. But when taking screenshots, use maximum resolution. Otherwise you may get it difficult.
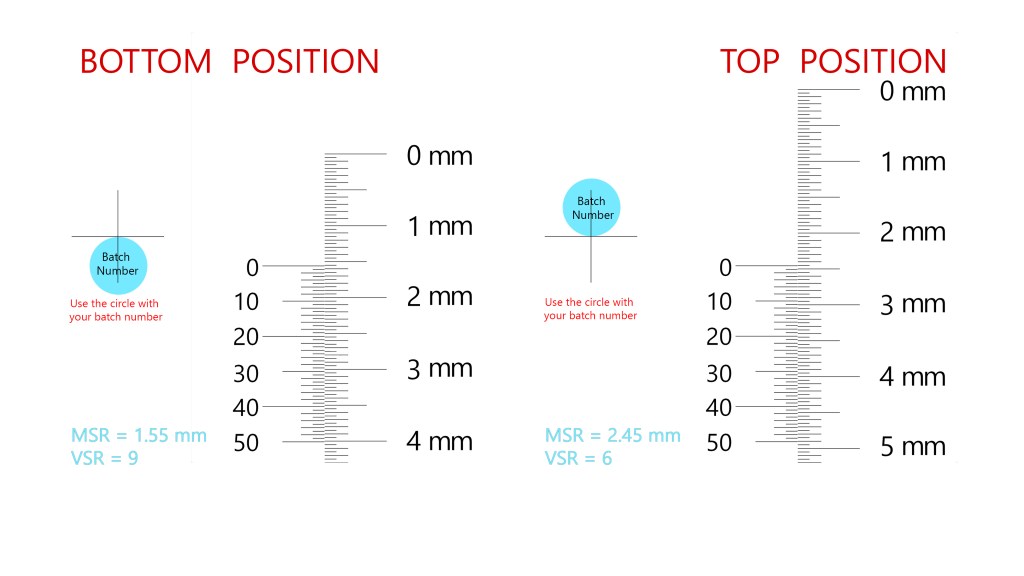
Video for Inner Diameter of the Capillary Tube
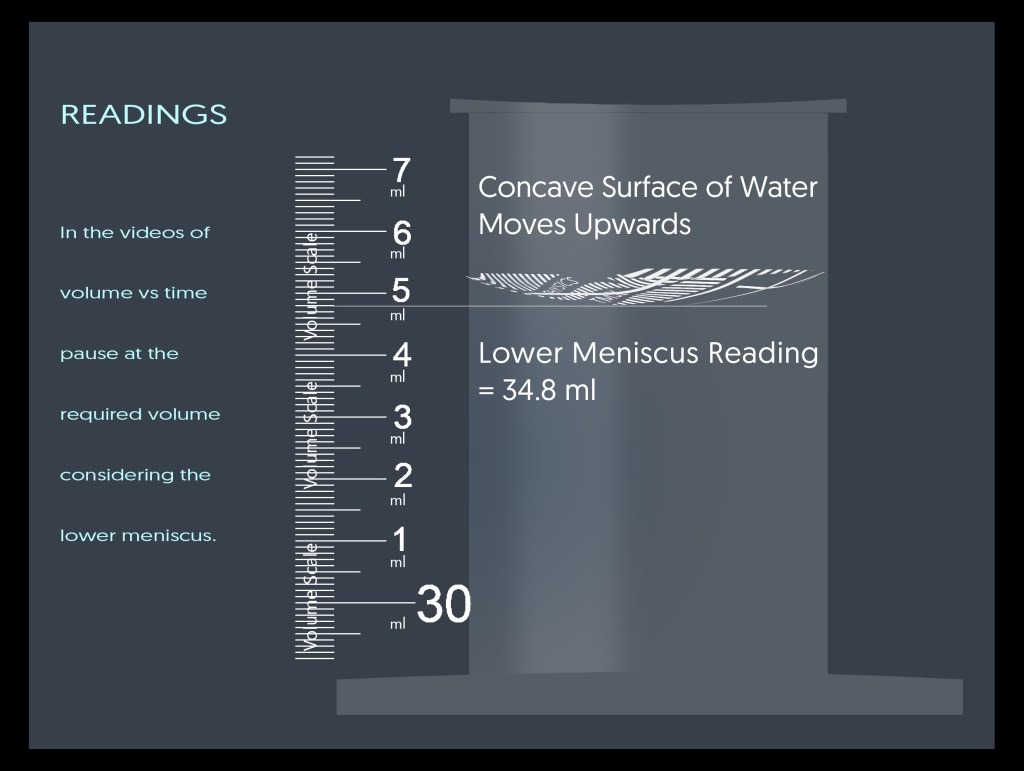
Video for Observation 3 (Corrected)
Data Submission
Make a single PDF file out of all your data including Photos, Docs and Screenshots (three of them are enough) and then upload it before 8:00 pm, 3 February, 2022 in the form below:

Session 3
How to draw the graph of this experiment?
Choose the paper orientation and axes with a reasonable choice of the scale of the graph. As height difference h between water columns of the manometer tube is independent in this experiment, Keep it along the x-axis. But the inverse of the slope should be used in the calculation. If there is some anomalous point, plot it but the line should not pass through it.
Ask Your Question (about postprocessing) 10:00 p m, 3 February, 2022 to 8:00 p m, 4 February, 2022

Answer of Your Question at 8:00 am, 5 February, 2022
Submit the Full Job Work with Post Processing Within 8:00 pm, 6 February, 2022.
Students, please name your PDF file with your name and (university roll number / ID number). Otherwise your given marks may be wrong.

Session 4
A Short Problem for Troubleshooting
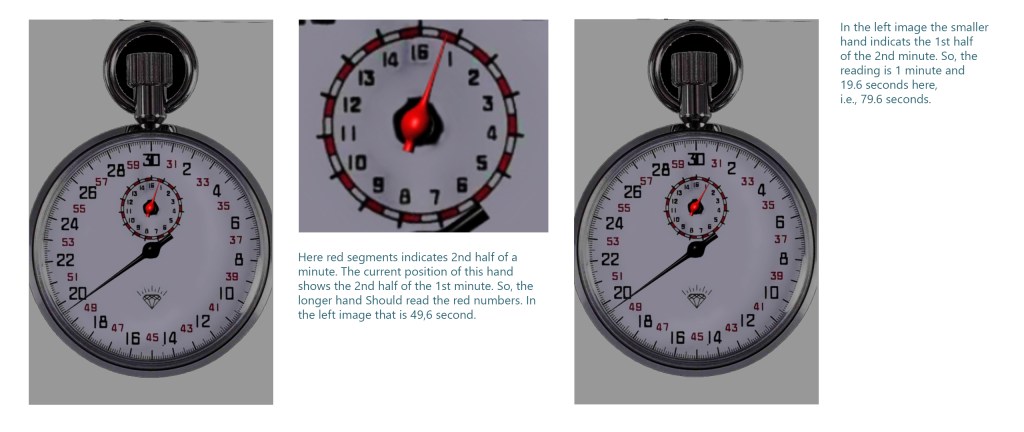
When a solid sphere is dropped into a glass of some liquid It is first accelerated but very soon reaches its terminal velocity. We can measure the terminal velocity using a stopwatch (available in mobile phones). Watch the video below:
When do the spheres reach their terminal velocities? The shot below is the indication:
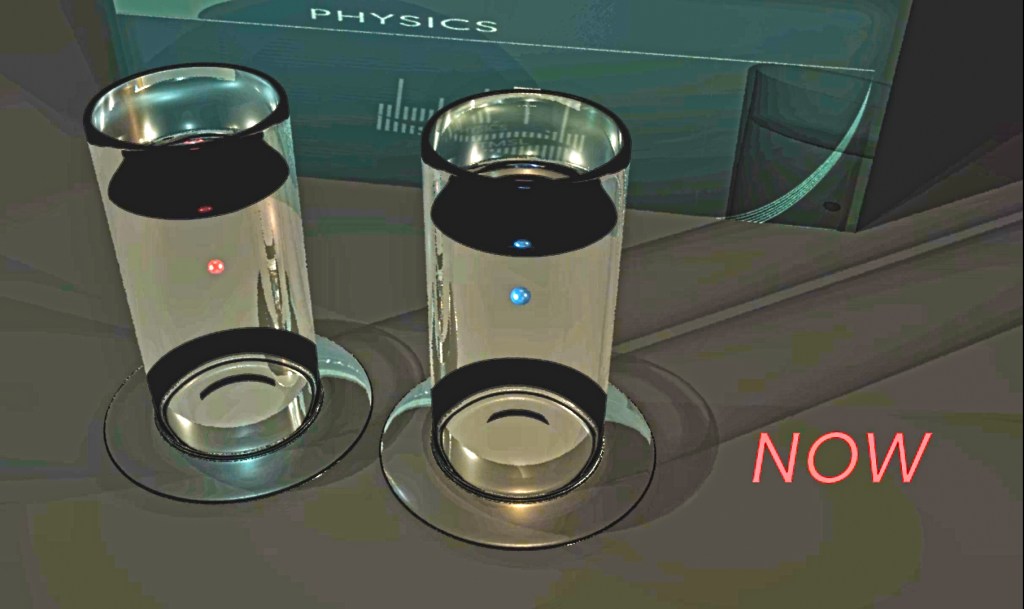
In the above video two different liquids are used and two different diameter balls are dropped into them. The balls reach their terminal velocities at the same time and in the same height. So one can compare their velocities with a stopwatch.
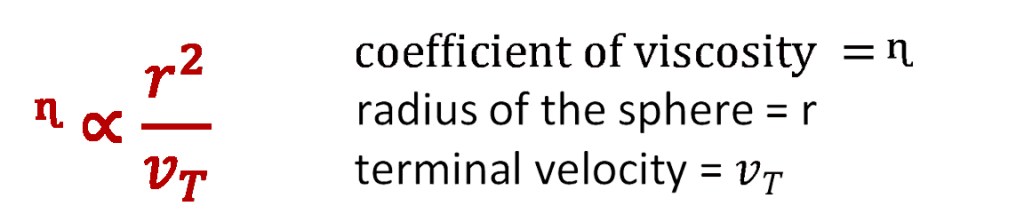
You have to find out the ratio of coefficients of viscosity of the two liquids. The formula is given below:
Use the following video to find out the ratio of the coefficients:
Now, fill up the following Google form. Time starts at 8:00 pm, 13 February 2022. It would be kept open longer, but the longer you take to submit, the less would be your credit.

See the answer of the test
