JOB 4
Session 1
Demonstration 9:00 pm, 22 November, 2021
A. Please watch the following video as many times as you need. Install the app in your android phone. Try it as directed. Write down on a piece of paper all the concerned questions you have in your mind.
Working Manual of the Experiment
B. Instruction for Data Taking
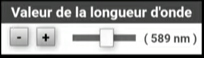
There are two necessities of setting wavelength.
First, you set a wavelength for getting an angle of minimum deviation, i.e., a condition where the angle of incidence becomes equal to the angle of emergence.
We set the first case different for different sections in the first chart.
Download and see for better clarity.
Second, you set many wavelengths for taking readings of angle of deviation.
We set the second case as follows in the second chart.
Download and see for better clarity.
C. Ask Your Question (about preprocessing) 9:00 p m, 22 November, 2021 to 8:00 p m, 23 November, 2021

See Questions Submitted
D. A brief demonstration video on the real lab experiment:

Session 2
Answer of Your Question at 8:00 am, 24 November, 2021

Make a single PDF file out of all your data including Photos, Docs and Screenshots (two of them are enough) and then upload it before 8:00 pm, 24 November, 2021 in the form below:
Session 3
How to Draw a Graph?
This time the graph is nonlinear. So we discuss a little bit about it. But remember, the steps of drawing a graph have to be the same as in JOB 2. Please see the PDF file for nonlinear graph for a better understanding.
Ask Your Question (about postprocessing) 8:00 p m, 24 November, 2021 to 8:00 p m, 26 November, 2021
Answer of Your Question at 8:00 am, 27 November, 2021
Submit the Full Job Work with Post Processing Within 8:00 pm, 27 November, 2021

Session 4
Please watch the video and then enter the next part.
Video for Reading from a Spectrometer Scale
The Vernier zero is the indicator of MSR (see the last MS line it has crossed) and the matching Vernier line is the VSR.
Now, fill up the following Google form. Time starts at 8:00 pm. It would be kept open longer, but the longer you take to submit, the less would be your credit.