JOB 5
Session 1
Demonstration 9:00 pm, 31 May, 2021
A. Please read the Wikipedia pages of Wheatstone Bridge and Carey-Foster’s Bridge for an idea of what the circuit is.
B. Now watch the following video as many times as you need. Try to choose Maximum Youtube Resolution. Write down on a piece of paper all the concerned questions you have in your mind.
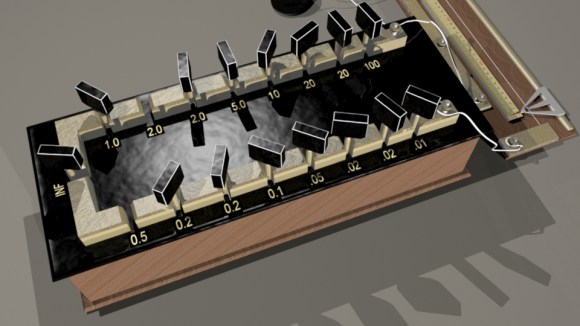
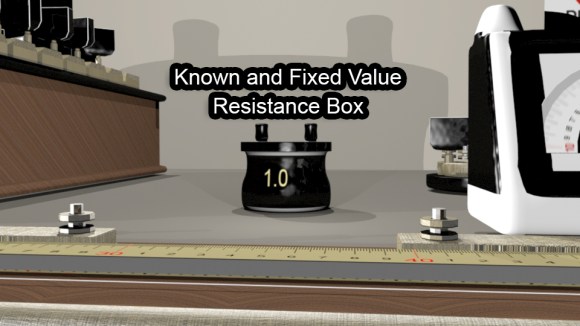
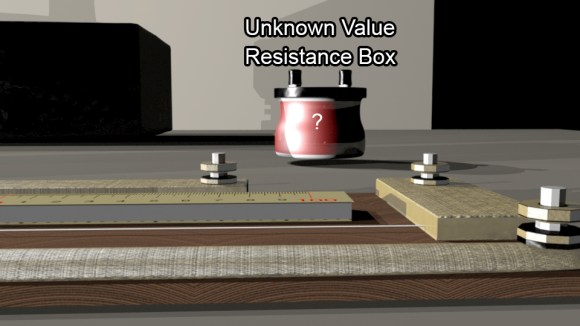
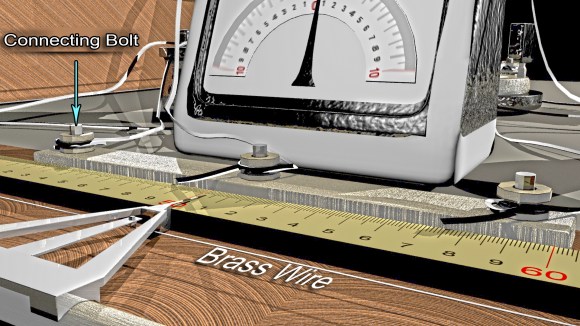
C. Here you see the still images of the components of the set up. Read in short about their functioning in the internet. You may need them later.


Manual for doing the experiment 9:00 p m, 31 May, 2021
D. A brief demonstration video on the real lab experiment
Instruction for Data Taking
E. Data should be taken strictly following the given resistance values. There should be a unique set of 10 resistance values for each batch. For each resistance there would be two readings in table 1 and two readings in table 2. So, totally 40 readings are necessary in this experiment.
What Values Would You Take? (CLICK)
Working Video
F. You have to open proper videos from the list below, pause them at Galvanometer reading = 0, and note the correct reading at the correct cell of table 1A or table 1B. “(A)” and “(B)” are table numbers here.
| Resistance | Direct (A) | Reverse (A) | Direct(B) | Reverse(B) |
| 1.0 | Video | Video | Video | Video |
| 1.1 | Video | Video | Video | Video |
| 1.2 | Video | Video | Video | Video |
| 1.3 | Video | Video | Video | Video |
| 1.4 | Video | Video | Video | Video |
| 1.5 | Video | Video | Video | Video |
| 1.6 | Video | Video | Video | Video |
| 1.7 | Video | Video | Video | Video |
| 1.8 | Video | Video | Video | Video |
| 1.9 | Video | Video ( Corrected) | Video | Video |
| 2.0 | Video | Video | Video | Video |
| 2.1 | Video | Video | Video | Video |
| 2.2 | Video | Video | Video | Video |
| 2.3 | Video | Video | Video | Video (Corrected) |
| 2.4 | Video | Video | Video | Video |
| 2.5 | Video | Video | Video | Video |
| 2.6 | Video | Video | Video | Video |
| 2.7 | Video | Video | Video | Video |
| 2.8 | Video | Video | Video | Video |
G. Ask Your Questions (about preprocessing) 8:00 p m, 29 November, 2021 to 8:00 p m, 30 November, 2021


Session 2
Answer of Your Question at 8:00 am, 1 December, 2021
Make a single PDF file out of all your data including Photos, Docs and Screenshots (four of them are enough) and then upload it before 8:00 pm, 1 December, 2021 in the form below:
Session 3
How to draw the graph of this experiment?
Choose the paper orientation and axes with a reasonable choice of the scale of the graph. This time we are taking data in two tables and having a symmetry between table 1 and table 2. The symmetry is around the unknown resistance. So first we plot all the readings (Mean of scale readings vs resistance) of table 1 on a graph paper in a proper manner and draw a best fit straight line (in a single attempt with a long ruler). Choose two far apart arbitrary points on the line and draw a triangle marking Δl2 and ΔR2. Then plot all the points for table 2 and draw the 2nd straight line in the same way. Draw another large triangle and mark Δl1 and ΔR1. Remember all the guidelines about making a graph discussed in JOB 2. A schematic image of the graph has been prepared to assist you with the idea.
Ask Your Question (about postprocessing) 8:00 p m, 1 December, 2021 to 8:00 p m, 3 December, 2021
Answer of Your Question at 8:00 am, 4 December, 2021
Submit the Full Job Work with Post Processing Within 8:00 pm, 4 December, 2021.
Students, please name your PDF file with your name and (university roll number / ID number). Otherwise your given marks may be wrong.

Session 4
Students, we are very sorry for the delay. Now, fill up the following Google form. Time starts at 8:30 pm. It would be kept open longer, but the longer you take to submit, the less would be your credit.