JOB 3
Session 1
A. Watch the following videos as many times as you need. Try to choose maximum YouTube resolution. Write down on a piece of paper all the concerned questions you have in your mind.
Working Manual of the Experiment

B. Wavelength of Sodium Vapour Lamp: 589.59 nm. The LAB FLEX explains many aspects of the dark room experiments. Download and see the left top scale in the flex.
C. Please try to take readings from the Demonstration Video 2 kipping the cross wire on both left and right sides of the same dark fringe. See the figure below. But remember, these trials for taking readings are not to be submitted. These trials are to be useful for asking questions. You shall later be given with working videos for data taking.

D. Ask Your Question (about preprocessing) 8:00 p m, 15 November, 2021 to 8:00 p m, 16 Novebmer, 2021
E. Working Videos:
To make a straight line, one has to plot at least 5 points. However. more points may be helpful. So, we suggest to use 6 fringes’ readings for plotting 6 points here.
In the video Demonstration Video 2 you see a part with voice-over and a silent part. Now, the silent part is going to vary according to your batch number. The radius of curvature would differ for different videos. So, the following video that is made for you is an extension of Demonstration Video 2. Take screenshots of readings.
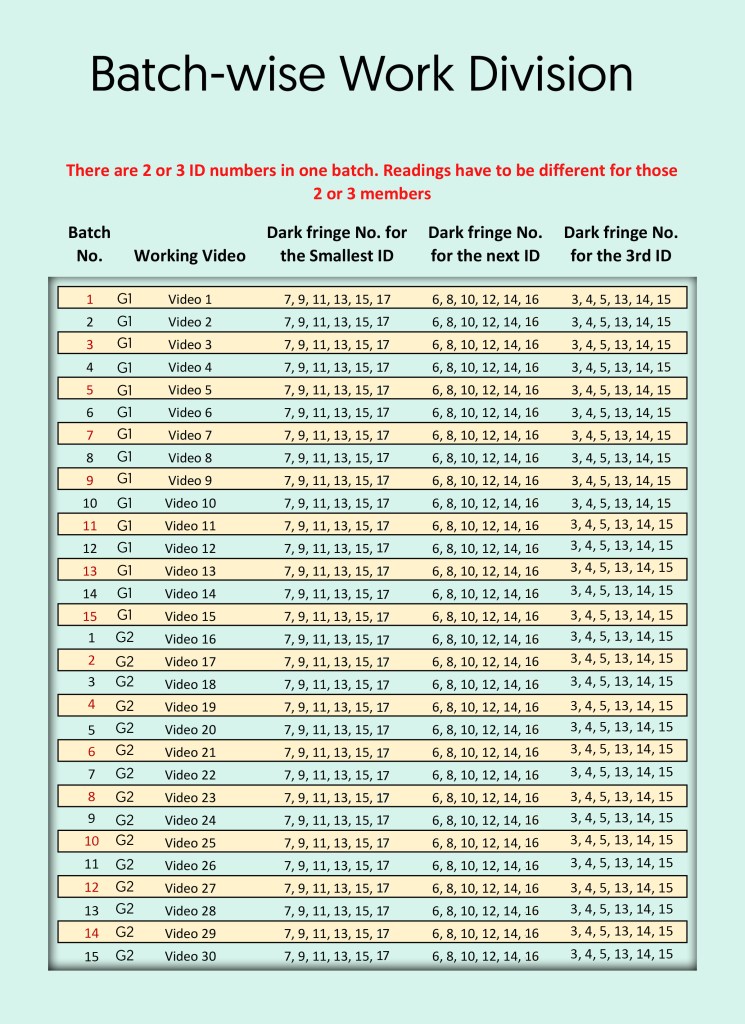
Click on the right video below and take screenshots:
We can look at some worksheet example of a related offline lab job. However, values do not match.


Session 2
Answer of Your Question at 12:45 am, 17 November, 2021

Submit Below the Data You Have Taken. 12:45 a. m., 17 November, 2021 to 8:30 p m, 17 November, 2021
Make a single PDF file out of all your data including Photos, Docs and Screenshots (two of them are enough) and then upload it in the form below:

Session 3
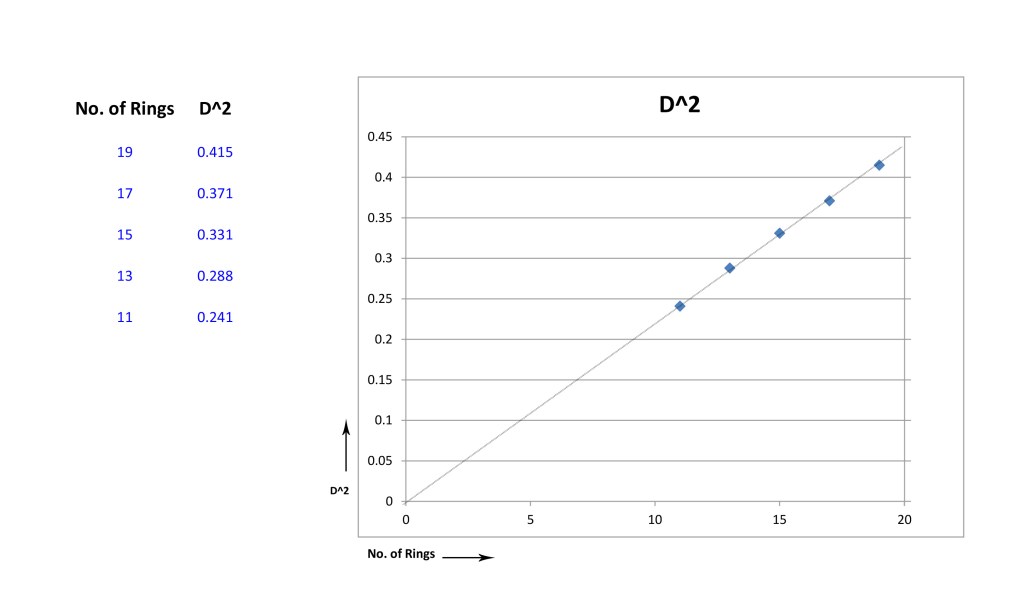
How to Draw a Graph?
As we have seen in JOB 2, there are steps for drawing a graph. This time we are not going to every details. We have already posted a worksheet example where some real lab data had been taken. Now see how MS-Excel draws a graph out of the same data set:
Now, we have to fit this graph with the scale of a 250 mm by 200 mm graph paper so that maximum area of the paper is covered by the graph. See below a demo of the scale. Do not consider it to be a supplement to your work. It can be a supplement of your concept only.

Ask Your Question (about postprocessing) 8:00 p m, 17 November, 2021 to 8:00 p m, 19 November, 2021
Answer of Your Question at 8:00 am, 20 November, 2021
Submit the Full Job Work with Post Processing Within 8:00 pm, 20 November, 2021

Session 4
Fill up the following Google form. Time starts at 8:00 p m 8 December, 2021. Duration: 30 minutes. It would be kept open longer, but the longer you take to submit, the less would be your credit.

See the Answers
